Tuesday, 21 December 2010

Will Johnsons Take Me to the Cleaners?

Johnson Service Group (JSG) pompously describes itself as a 'leader in managed services'. In the real world, it cleans clothes, hires out linen and looks after buildings. Not the most glamorous of things, but surely not something that can go terribly wrong? 

Think again. Looking at the five year share price graph, some shareholders might consider that the Company is so proficient at cleaning that it has managed to clean out their wallets too. 

In the past five years, the share price has fallen from a high of 467p in January 2006 to a low of 5p in February 2009.

The current share price of 30p (as at 16 December 2010) gives the company a market value of £75m. Based upon the 2009 basic EPS of 4.7p, this represents a PER of 6.4x. 

For the record, my average cost per share is 22p and after dividends equating to 1p per share, my break-even is 21p per share. I am therefore sitting on a paper gain of 41%. I want to understand whether this was luck and/or judgement, and whether I should be topping up or baling out.

Background

JSG is comprised of three main divisions: (i) Textile Rentals (work-wear rentals and laundry services to trade); (ii) Dry-cleaning (Johnsons is the eponymous brand) 
and (iii) Facilities Management.

The wheels first started to come off in 2006 when the Company experienced IT, stock and local management issues, all of which conspired to generate exceptional costs, write offs and rising debt levels in 2007/8. A new CEO (Skinner) came and went, the 2007 final dividend was cancelled, £30m of new equity was raised through a Placing, Johnson Clothing (the UK's largest provider of corporate clothes was sold off in an MBO for £82m), the shares were transferred to AIM, the debt facilities were refinanced (following a breach of covenants), and John Talbot, an experienced turnaround professional, became CEO. Talk about a boring and uneventful couple of years...

So where are we now? Based upon a review of the 2009 Annual Report, the Company appears to have found a sense of stability. Net debt was down to £68m (less than half of its peak a few years before), the dividend returned (albeit at modest levels), operating cash flow improved, Textile Rentals (with an element of contracted revenues) accounted for 50% of turnover but over 80% of the operating profit in 2009 should help to provide some robustness to earnings.

The Rules

1 - Assets -  the net assets on the 2009 balance sheet total £71m compared to a market cap of £75m, which implies that the Company is essentially being valued at book-value. On the face of it, this looks reasonable. However, one must consider the £88m of goodwill sitting on the balance sheet. It is difficult, if not impossible, to know what the true value of a business is (other than what someone is prepared to pay for it), so one cannot say whether this is a 'fair' value or not. At least the net assets are not being valued at a premium above book value. 

2 - Market Cap - at £75m it is higher than the £50m floor.

3 - Cash Flow - (a) there are net current liabilities of £9m at December 2009 (v £1m of current assets at December 2008), which is explained partially by £7m of debt repayment now falling due within 12 months and a reduction in trade debtors and other receivables (net of trade creditors); (b) operating cash of £28m (EBITDA of £48m less interest of £7m and 'replacement' capex of £12m) looks good. Out of this, we need to pay the Tax Man (£6m - 2009 P&L), dividends (£1m), and debt repayments (£11m). This leaves £10m for acquisitions, working capital and pension obligations (note the £13m payment to the defined benefit pension scheme in 2009, but it does jump around).

All this leads me to believe that the Company is generating adequate cash for its current needs, but its £60m of future debt repayments (all of which is due to be repaid in the next 5 years) and £20m pension deficit are going to put pressure on any material growth in the size of the dividend in the short-term.

4 - Debt - (a) with net debt of £68m and balance sheet equity of £71m, there is a net debt:equity ratio of 0.95, which is above my target of 0.5 times (ie 50p of debt for every £1 of balance sheet equity), but does not represent ridiculous over-leverage; (b) there is an EV/EBITDA ratio of 4x, based on an EV of £143m and adjusted EBITDA of £36m (less replacement capex). This is at a perfectly reasonable level.

The other point to note about debt is the defined benefit pension deficit. Unlike other debt, where you have certainty over the costs and repayment schedule, pension debt is baffling, not least because it sprawls over five pages in the 2009 Annual Report. Whilst it is a debt obligation insofar as it will snaffle future cash and profit, it jumps around depending on the vagaries of the market and the outlook of actuaries. Because of the variability, I exclude it from the pure definition of debt, but will keep a close eye on it, especially from a cash flow perspective.

5 - PER - a current PER of 6.4x (2009 basic EPS) is conservative and probably reflects the burnt fingers of institutional investors and the AIM listing (unloved and under the radar). No doubt it's tough out there, especially for a company with High St exposure such as Johnsons dry-cleaners, but I am comforted by the contracted revenues of Textile Rentals.

It's easy to get fixated with what the most appropriate measure of EPS should be (basic, diluted adjusted etc), but as a sense check, EBITDA (a proxy for cash profits) for the past four years (2006-2009) comes out at a healthy and reasonably robust £49m, £36m, £44m and £48m respectively, an average of £44m pa.

6 - Yield - the 2009 DPS was 0.75p, representing a yield of 2.5% based on the current price. This is beneath my target yield of 3.5%. Based on 2009 basic EPS of 4.7p, the dividend is covered a healthy 6 times, suggesting that there is scope to increase the dividend, although probably not too much in the short-term given that cash will be used for working capital and debt repayment.

7 - ROE - the 2009 ROE was 12.7% and is greater than the 10% target.

8 - Directors - the eight directors hold 5.6m shares directly (value of £1.7m), and of these the CEO (Talbot) has 3.8m (£1.1m). Stripping the CEO out, the other directors hold on average c250,000 shares each (£75k), which is a little on the low side. In addition there are an additional 14m share options/LTIPs kicking around, which provide an extra incentive for the directors to improve the share price.  In general, the director remuneration looks reasonable for a company of this size.

Post-scipt: the directors added another 2.7m shares in September, following the release of the interims, which takes their direct holding to 8.3m (£2.5m).

9/10 - Buy or Bye? At this stage, I would wish to examine the 10 year record to see how the company is valued in the context of long-term earnings and valuation multiples. Clearly, the Company going into 2011, is in a very different shape to the one that thrived and (just about) survived throughout the last decade, rendering any comparison as troublesome.

The 10 year basic EPS average is 3.4p, although if you strip out 2007 and 2008, it jumps to 23.7p! The average PER is 9.0x, although if you strip out 2007 and 2008 again, it jumps to about 11.2x (albeit on the Main Market).

Recent Developments

In the interims (6 months to June 2010; released in September 2010), the CEO announced progress in line with expectations. Turnover was under pressure, margins held up, net debt had fallen to £65m, but the pension deficit was up, an increased interim dividend (up 8% - or a mighty 0.02p!) and an opportunistic acquisition of some PFI contracts from the remnants of Jarvis. All in all, steady progress, with a focus on cost control (if not reduction), cash generation and revenue protection.

Conclusion

In terms of valuation, I propose that a current EPS of 4.7p feels about right (=£11.5m PAT), but a slightly higher multiple should be reasonable, at say 9x. This gives a target sale price of 42p. If JSG reaches this price by Christmas 2012, I will have generated a return of c100% and an IRR of 25-50% depending on how quickly we get there.

Whilst a jump from 30p to 42p sounds high, the shares have had some momentum recently, climbing from 16p to 30p in the space of 6 months. The directors acquired 2.7m shares in September, which must have helped to stimulate matters.

But should I buy some more given that I believe a further 50% upside is achievable? If the yield was a bit higher, the debt a bit lower and there was a bigger discount to net assets, it would be a screaming buy. However, given my relatively low entry point, I find it difficult to add new shares at a much higher base cost. Maybe it's a psychological thing, or maybe I want to keep my powder dry for other investment opportunities that offer a bigger perceived discount, but in the meantime, I'm going to HOLD, with a TARGET SALE PRICE OF 42p. I will review my analysis when the 2010 final results are published, as a solid set of results, may act as a trigger for a re-rating.

Friday, 10 December 2010

GSK: Hero or Headache?

The trouble I have with GlaxoSmithKline (GSK), other than the unfeasibly long and contrived name, and that is even after dropping the Beecham part, is that it has done nothing for me. 

I first acquired shares back in August 2006, have topped up from time-to-time, and am sitting on a spectacular gain of...wait for it...8%. That's total, not per annum. Potentially worse still, is that all of that gain (and more besides) is a consequence of dividends. What I want to establish is whether I massively overpaid for the share or whether I've backed a cart horse.

The other reason that it has appeared on my radar, is that a lot of commentators have tipped GSK as a worthy, if dull, defensive play, on a yield of c5% and a PER of c10-11x, giving it the notional characteristics of a value share.

For the record, my average cost per share is £13.18 and I've had £1.82 per share in dividends, which brings my break-even price to £11.36 per share. The current share price is £12.42 (as at 10 December 2010).

Background

GSK is a very large and well analysed company, being the sixth largest company (by value) in FTSE 100. It is likely that, whether you realise it or not, GSK touches some part of your life and your share portfolio.

As the long-winded name suggests, the Company is an amalgamation of companies that have been added/merged en route to support whatever strategy was in place at the time.

Revenues are broadly split between Pharmaceutical products (prescription drugs and vaccines) (84% of 2009 revenues) and Consumer healthcare (medicines, healthcare and soft drinks) (16% of revenues).

The current strategy is three-fold: (1) grow a diversified global business (cue emerging markets growth), (2) deliver more products of value (make R&D pay) and (3) simplify the operating model (improve efficiencies).

The threats that the business faces include: 'genericisation' (drugs coming out of patent - this represented lost sales of £1 billion in 2009); the need for R&D - generally around 14% of turnover - to find new drugs as quickly as they fall off the patent cycle, and an ever-growing litigious society. 

I am not going to pretend that my analysis is going to add anything new to the volumes of research out there, or that I'm going to be able to find a hidden gem in GSK, but I will be taking a big picture view on current valuation versus a historical perspective in particular.  


Source: London Stock Exchange
  In the last 12 months, the shares have traded at a high of £13.39 and a low of £10.95.

However, on a 5 year trend, the highest point was £15.74 in March 2006. This shows neatly why, in hindsight, I bought at the wrong time!


The Rules

1 - Assets - net assets of £10.7bn (December 2009) compares to a market cap of c£64bn. The assets are trading at a significant premium to book-value. There is an element of goodwill from acquisitions, but the 'market value' of the product portfolio is reflected in the market cap  and not on the balance sheet. I am in no position to estimate the future sales of each product on a DCF basis, so I won't attempt to.

2 - Market Cap - with a market value of £64.5 billion, it just about squeezes past my minimum hurdle of £50m...by a factor of 1,290x.

3 - Cash flow - (a) balance sheet - there are net current assets of £5bn, which is encouraging...(b) operating cash - operating cash of £9.5bn less interest of £1bn (top-end) and £1bn replacement capital (guess) = £7.5bn. Out of this, we need to pay the Tax Man £2bn and dividends of £3bn, which leaves a buffer of £2.5bn for future debt payments and strategic stuff (acquisitions etc). On the whole, the cash side of things looks positive.

4 - Debt - (a) a debt to equity ratio of 0.9 is high (for my rules) but probably reasonable for such a large company with stable cash flows; (b) net debt of £9.4 billion, equates to an EV/EBITDA multiple of 8.5x based on an EV of £74bn and adjusted EBITDA of £8.7bn. This represents quite a full multiple and probably reflects the size and relative stability of the cash flows. 

5 - PER -  based upon a 2009 basic EPS of 109p and a current price of £12.42, the current PER is 11.4x, which is beneath the target ceiling of 12x.

If we look at long-term earnings and a 10 year basic EPS of 80.3p, the PER rises to a not-so-much-value 15.5x.

6 - Yield - the 2009 DPS was 61p, representing a yield of 4.9%, based on the current share price of £12.42.  The cover based on 2009 basic EPS is 1.8 times, which is satisfactory.

The Company has a progressive dividend policy in place and increased its 2009 dividend by 7%. In fact, the dividend has increased every year since 2000 (my starting point), and this equates to annualised increase of 5.4%, which represents real growth in income. Good stuff.

7 - ROE - the 2009 ROE (per Sharelockholmes) was 61.4% and the average 10 year ROE is 62.2%. This appears to be high as the denominator (shareholders funds) never seems to increase much as each year's profit is 'spent' on dividends and share buy-backs.

8 - Directors - as one would expect for a large multi-national (nowadays at least), the directors were rewarded handsomely. The director remuneration bill totalled £11.8m (including leavers), and of this, the three executive directors had an average salary of over £2m each.

In addition, the three executive directors directly hold over 200,000 shares (£2.5m), as well as having various share options over c3m shares (at low exercise prices).

9/10 - Buy or Bye? A 10 year average EPS of 80.7p and a 10 year average PER of 15.6x, gives a 'long-term' fair price of £12.59. Interestingly, this is within a whisker of the current market price (£12.42).

Conclusion

I think that GSK is a well-run company with lots of defensive qualities, nice yield, growing earnings and an acceptable capital structure. For me, the current price is a fair price and reflects the fair value of the business. On this basis, the return that I am likely to get from investing in GSK is below my target IRR of 15%, which means that I will probably sell the shares to release the funds for something that does meet my requirements.

Despite being a big admirer of the Company, I can't see sufficient value at this price and, after all, I'm trying to achieve market-beating returns. 

"Price is what you pay. Value is what you get." Warren Buffett

Monday, 6 December 2010

Is the Sun Shining for PVCS?

I first bought shares in PV Crystalox Solar (PVCS) plc at 91p a throw in April 2009. I remembered being attracted to the perceived discount and growth potential at the time, and have averaged down since, to a cost of 70p, as the share price seems to have been in perpetual free-fall. After cumulative dividends of 4p, my break-even cost is now 66p, which compared to a current market price of 53p (2 December 2010) leaves me sitting on a paper loss of -20%.

I don't like losses any more than I like sun-stroke, so now is the time to evaluate (a) whether I should have bought the shares in the first place (based on my new rules) and (b) whether to buy, hold or sell.

Background

PVCS doesn't adhere easily to the mantra of 'only invest in companies that you understand'.

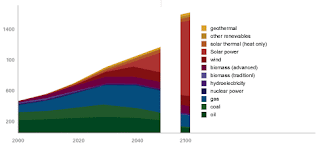
Big picture: the world's energy requirements are increasing (more people, more middle-classes, more technology etc), the 'dirty' energy sources are neither green nor politically correct (unless you're a Texan), and are expected to run-out eventually, meaning that the gap needs to be filled. I quite like this graphic from the PVCS web-site, which sums it up neatly, although may not be totally unbiased. 

There is a dynamic between the point at which the 'dirty' energy sources start hitting a down-ward trend (about 2030 according to this graph) and which alternative energy source will come to dominate thereafter. Solar power is purported to be the answer, according to this graph at least.


So, where does PVCS come into it? For a more detailed explanation, see the website - http://www.pvcrystaloxsolar.com/PhotovoltaicEffect.html ...but in essence PVCS manufactures silicon-based photovaltic cells which convert the suns rays into energy.

There are various stages to the production process/supply chain, but PVCS concentrates on manufacturing the ingots and wafers in the UK and Germany, and making wafers and selling through an operation in Japan.

The Company was founded in 1982 and listed in 2007, raising Euros 73m to help build the new plant in Germany (moving down the supply chain to secure solar grade silicon supplies). Key attractions in the Prospectus included: the IP to produce 'wafer-thin'...er...wafers, and long-standing relationships with the big Japanese boys, although the top three suppliers did account for 73% of sales at time of listing.

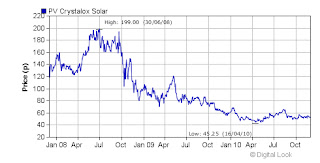
So, what has happened since the listing? The German factory has opened and is scaling up to full capacity in 2011, but that has happened against a back-drop of over-supply in all parts of the value chain, which has caused prices to plummet by up to 40%, and there are question-marks over the level and longevity of government subsidies (particularly in Spain, but offset by growth in Germany (higher volumes, lower prices) and Japan). Unsurprisingly, the share price has been heading in one direction only; like a sun-set.

Source: Digital Look, from PVCS website


The shares traded within a whisker of 200p in July 2008 and fell as low as 45p in April 2010. Based on the current price of 53p, the Company has a market cap of £222m, which represents a PER of 8.8 times 2009 basic EPS of 7.2 cents (= 6p). A low PER is the starting point for a bargain share, so let's have a look at the rest ...


The Rules

Based on the accounts for year to December 2009 and assuming I can get Euros 1.2 for my £...

1 - Assets -  shareholders equity of £216m on the balance sheet versus a market cap of £222m. Assets valued at par; hurrah. Of the net assets, £100m is in relation to tangible assets (property, plant & equipment) and a very small monetary value is attributed to the goodwill (patents and software). I'll come on to working capital and debt in later sections, but at this stage, am comforted by the sensible market cap in relation to the net assets. A discount would have been nice, but let's not get greedy...

2 - Market cap - greater than £50m. Job done.

3 - Cash flow

(a) balance sheet: current assets less current liabilities = +£125m, looks very healthy. No problems in being able to meet short-term obligations, especially given the net cash position of £+58m.

Better still, there is (almost) enough cash in the bank to meet all liabilities: current and long-term. This favourable position has persisted for the last three years, although is unwinding as the Company has taken on more debt and invested in the building of the factory. It is worth noting that in the last three years, the Company has received grants and subsidies of £19m, which has helped to contribute towards the £71m cost of the German facility.

(b) operating cash: operating cash after working capital movements and interest was £36m, but out of this, we need to pay the tax bill (£33m - high due to bumper profits in 2008), before even thinking about capex and dividends (£20m). If we 'normalise' (I hate that word) the tax figure with the 2010 P&L charge (£11m), we come up with an adjusted operating cash figure of £25m, which helps to cover the dividends. That gets me reasonably comfortable that the Company generated sufficient operating cash in 2010 to support the dividend payment. I have conveniently ignored replacement capex as there is too much going on with the new factory to get a feel for what is replacement and what is required to support future growth.

Below operating cash, the cash flows jump around with increasing capex, offset by grants, new bank debt and forex movements.

4 - Debt

(a) gearing - there is cash on the balance sheet of £83m and debt of £25m, resulting in a net cash position of £58m. The debt has jumped around a bit, but since the refinancing in 2009 with Sumitomo

(b) EV/EBITDA - an EV of £164m (£222m-£58m) versus 2010 EBITDA of £44m, results in a ratio of 3.7x, which is very reasonable. It looks even more reasonable if one takes the average EBITDA of the past three years (£77m), resulting in 2.1x.

5 - PER - 2009 basic EPS was 6p per share, which generates a current PER of 8.8x. Ideally, we would want a 10 year EPS to test, but the Company has been listed for three years only, and due to a bumper 2008, average EPS increases to 13.2p per share, bringing PER down to 4x. There are profit figures contained in the listing Prospectus but these were generated under a different capital structure and therefore are not directly comparable. For interest, if we include these, we get a 6 year average EPS of 7.7p, which results in a PER of 7x.

For the purpose of this valuation, I will suggest that we are trading on a PER of 7-9x, which gets us into value territory. 
Whilst 2008 was a good year, it looks particularly good from a comparison point of view with 2009, as profits were inflated by a net £37m currency benefit and a lower depreciation in 2008. This shows the perils in looking purely at a basic EPS calculation. However, ongoing margin pressure and increasing depreciation will put further downward pressure on EPS, and will help to prolong any potential re-rating in the market. 

The new borrowings in Yen should provide a natural hedge, and help to stabilise these currency swings a bit.

6 - Yield - the 2009 DPS was 2p, which results in a yield of 3.1% and is as about as low as I'd like to go. The dividend has jumped around dependent upon earnings, but has averaged around 3.7p over the past three years, which would represent a yield of 5.9% based on current price. A note of caution though as the 2010 interim has been halved, which means that the level of dividend is under threat in the short-term.

On the plus side, there is plenty of earnings cover and cash to support payment of future dividends. The 2009 Annual Report makes reference to resuming a progressive dividend policy when conditions allow, which is comforting.

7 - ROE - the average ROE for the last three years is a healthy 26%, which ticks the box. Again, a longer time-frame is required to give a real level of confidence, given that this period covered a boom year in 2008.

8 - Directors - although the directors take nice salaries and bonuses, they still have a hefty investment in shares (largely due to owning a big slug at the time of IPO). The CEO has 44m shares (£23m) and the other directors hold 12m shares (£6m), which leads me to believe that they have enough skin in the game to act in the best interests of all shareholders. Given the size of these large holdings, there is little evidence of director buying, but they can be forgiven for that.

9/10 - Buy or Bye? A three year EPS of 13.2p and a three year-rating of 8.2x (courtesy of Sharelockholmes) gives us a (not very) long-term 'fair' price of 108p.

This is heavily caveated by the short trading history as a listed company, exceptional profits in 2008 and an evolving market.

Recent Trading

The 2010 interims (September 2010) were mixed but the Interim Management Statement (November 2010) was a bit more bullish. Higher volumes and stable prices were positive, but revenues were flat v H1 2009, margins were down, EBITDA down 40% and the interim dividend was halved. On the balance sheet, cash has gone up, net current assets has gone up and net assets have increased (meaning that the market value is now at a discount to net assets), although currency fluctuations have helped. Chinese, Japanese and Taiwanese markets are growing, which should help volumes to continue growing.

Conclusion

After all that, my head hurts. My take on it is that the market probably over-valued the share (mini techno bubble) in 2008 and is now more circumspect about future prospects, probably under-valuing the Company, having been "bitten once, twice shy".

From a valuation perspective, I like this share. Slight discount to net assets, earnings multiples not expensive, lots of cash kicking around, good return on equity, high director stake and a dividend. 

What I don't like about this Company is that earnings have jumped around so much in its short history, which is a reflection of the vagaries of an evolving technology in an evolving market in an evolving world. Green is "in", but requires lots of subsidies to make it work, and current growth appears to be fuelled by the Asian economies, but what happens if they slow down? There is also a battle to be had between which alternative energy supply will come to dominate, although that battle might be a way off, and which technology will come out on top within solar.

If I came across this Company anew, I would probably hold-fire on a new investment, purely because of the lack of long-term trading history on the ability to generate long-term sustainable profits, and the sectoral issues that need to play themselves out. I can rationalise why I bought the share in the first place, albeit without the assistance of some rules to test, with evidence of a low valuation and lots of cash sloshing around.

If I am going to hit my aspirations of a 15% IRR, I need the price to hit 110p by December 2013 (assuming a three year window and a 2p dividend per annum) from my current starting point. A price of 110p is well within the range considering the all-time high and would represent an EPS of 12p on a PER of 9x, both of which should be achievable, although a modest re-rating would certainly help. Interestingly, this is within a whisker of my caveated fair price of 108p above.

In the absence of further information, I am going to HOLD, with a price target of 110p. If the price drops below 50p, I will consider topping up. 

The sun is shining for now.